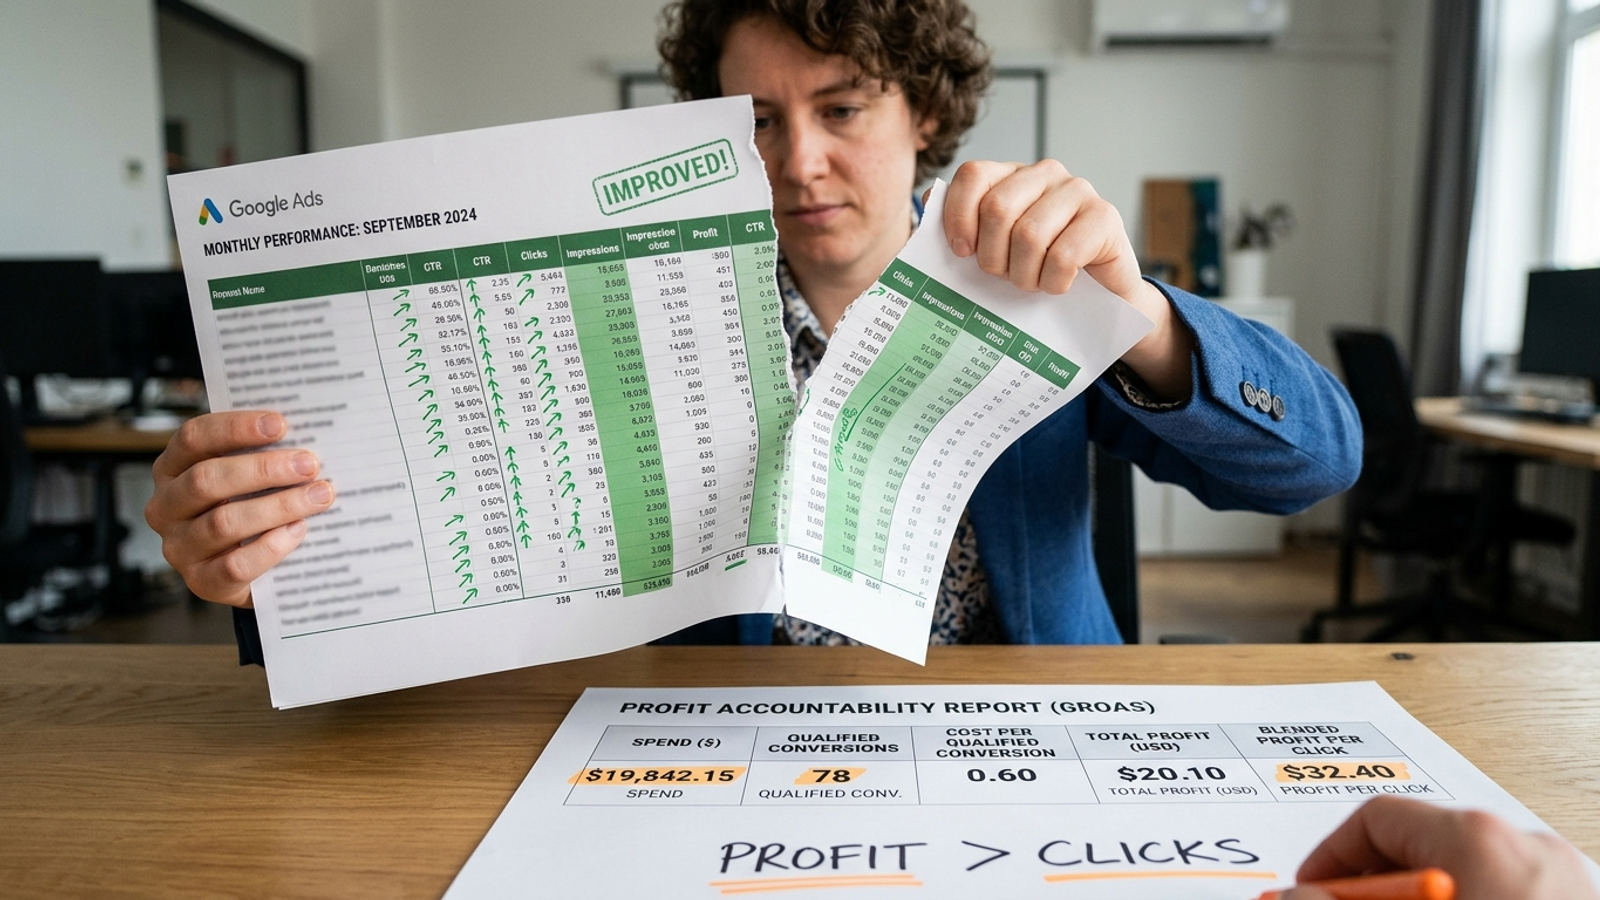
Say you are spending $20k a month on Google Ads. CTR is up 18%, clicks are up 32%, and impression share is holding at 78%. Everything in the report is green. Then you check booked jobs or closed revenue, and the line is flat. Maybe down.
I sat on both sides of that call for years: first as the guy sending the green report, later as the guy asked to explain it.
Most agencies will not tell you this straight: green Google Ads metrics are not proof that the account is working. I used to lead with them because they almost always move in the right direction when you raise budgets or loosen targeting. It made me look competent. I was wrong to do it.
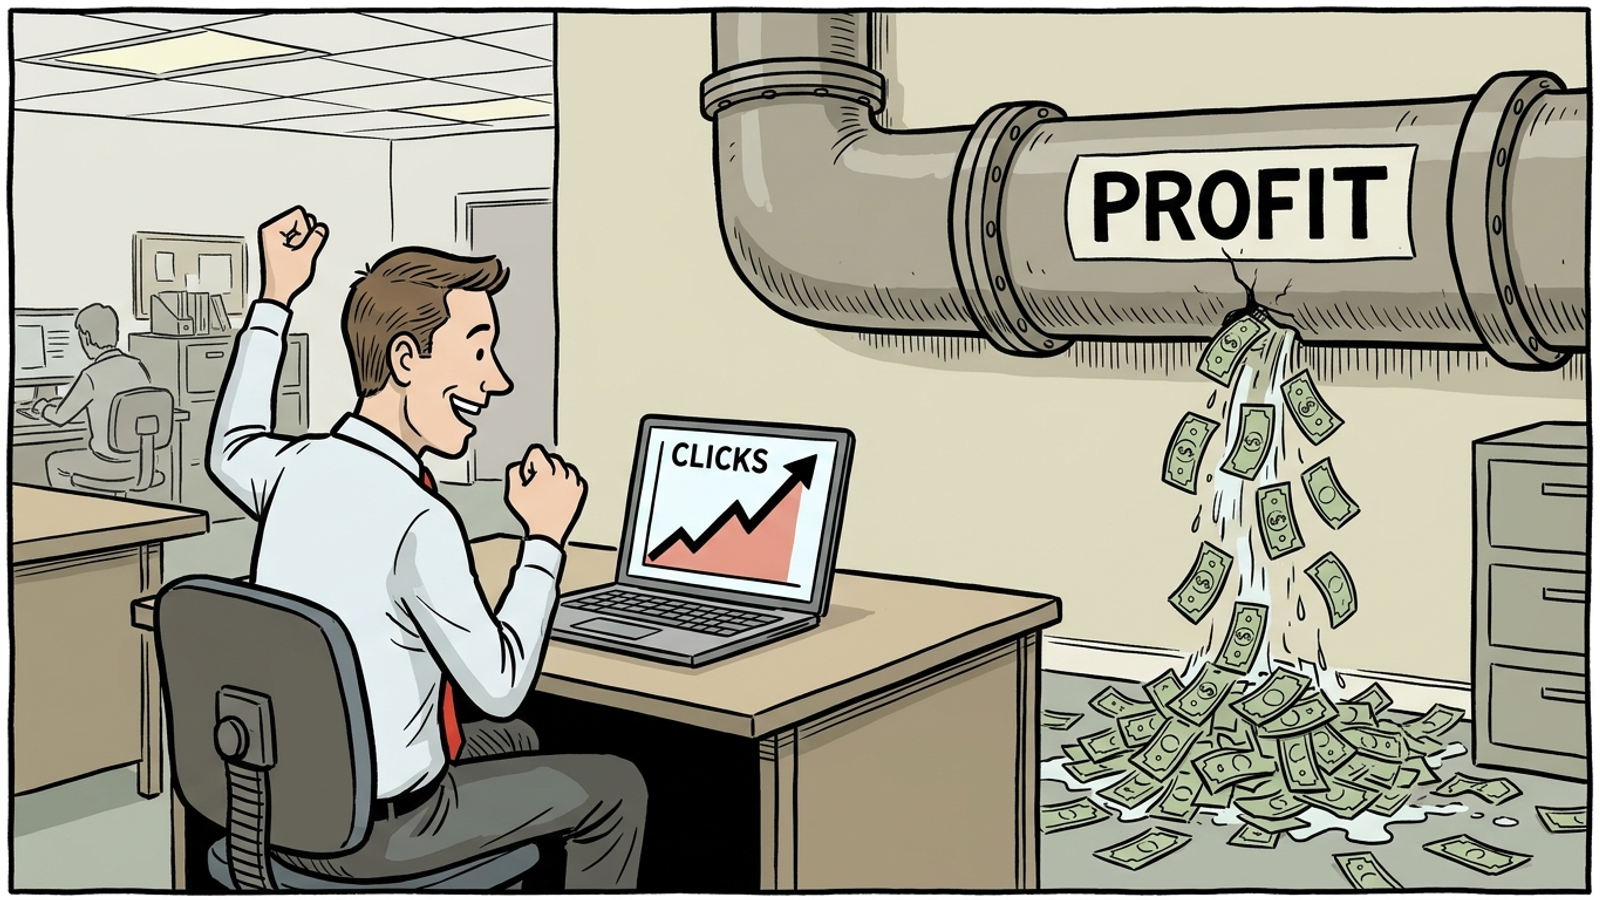
Clicks measure that Google charged you. Profit measures that something valuable happened after.
This is my correction: the three vanity metrics I see hiding weak accounts, why Google puts them front and center, and the small set of profit signals I check before I touch a bid or a budget.
Why Google Ads dashboards keep rewarding the wrong numbers
Google puts impressions, clicks, and CTR in the default columns for a reason. That reason is not your profit.
Those columns update fast. They usually go up when you spend more. They make the interface feel responsive. Revenue data arrives late, depends on your tracking, and half the time it is broken. So the path of least resistance is to manage whatever Google shows you first.
I did that for two ecommerce brands in 2019. I chased a 6% CTR like it was a grade: widened match types, added broad terms, watched CTR hold, and watched CPA creep from $41 to $68. The dashboard never flagged it. The bank account did.
Agencies keep the habit alive because vanity numbers are easy to report and hard to argue with. “Clicks up 32%” fills a slide. “Profitable revenue per click is down 11% after returns and unqualified leads” starts a difficult conversation about tracking, offer, and close rate.
What the deck calls full-funnel visibility, I call a report that shows everything except whether you made money.
If a number rises when you spend more and nothing else changes, treat it as a cost receipt, not a performance signal.
The three-metric audit I run before changing anything
When I take over an account, I ignore the green arrows for the first hour. I pull the same three numbers in the same order:
- Impressions and impression share
- CTR
- Raw clicks
Each has a specific way of flattering you. Each has a replacement I trust more.
1. Impressions and impression share: a receipt for showing up
High impressions feel like demand. Most of the time, they measure that you bid wide enough to appear.
I had a home services client thrilled with 94% impression share on his main campaign. We broke it out and found that 70% of those impressions came from three broad phrases with the word free buried in the query reports, plus a radius that pulled in two towns he did not serve.
He was dominating an auction he should not have entered.
Impression share tells you how much of the bill you captured, not how much of the market you should want. The useful version is qualified impression share: the same column, filtered to exact- and phrase-match terms with buying intent and ZIP codes where you actually close work.
If your 94% becomes 31% after that filter, you do not have a visibility problem. You have a waste problem.
Practical takeaway: segment impressions by intent before you celebrate them.
2. CTR without conversion context: the grade that does not pay you
Google defines click-through rate as how often people who see your ad end up clicking it: a gauge of how well keywords and ads are performing. That is useful for diagnosing relevance. It is useless as a success metric.
I learned this on a SaaS account where CTR climbed from 3.1% to 5.4% after we rewrote headlines to be punchier. The client was happy for two weeks. Then sales reported that the new clicks were mostly job seekers, students, and people looking for a free tool.
Conversions held flat. Cost per qualified demo rose from $212 to $348. The higher CTR had simply made a broader promise to a broader crowd.
I see the same pattern in accounts that brag about beating the roughly 3% search average. A high CTR on the wrong query is not efficiency. It is cheap attention at full price.
CTR only means something when it is tied to what happened after the click. I read it as CTR by intent: exact queries with buying language versus everything else, with conversion rate beside each.
If your 5.4% CTR converts at 1.1% and your 2.8% CTR on narrow terms converts at 6.4%, the lower CTR is carrying the business.
Practical takeaway: never report CTR without conversion rate in the next column.
3. Clicks and traffic volume: the easiest number to buy
Clicks are what Google sells you. More budget buys more clicks almost every time, which is why clicks are the first line in most monthly reports and the least informative one.
One ecommerce brand I audited had clicks up 41% quarter over quarter. Revenue was up 4%. The gap came from Performance Max finding cheaper clicks on mobile placements that never added to cart, plus brand terms cannibalizing organic traffic the client would have gotten for free.
They paid to acquire their own customers twice and called it growth.
Details like that are exactly what free audit tools miss because they grade hygiene, not profit.
I treat a clicks increase as a question, not a win:
- Where did the extra clicks come from?
- What did each cohort cost?
- What did each cohort return?
If you cannot answer those three questions, you did not scale. You spent.
Practical takeaway: split clicks by campaign intent and device, then attach revenue before deciding the volume was worth it.
The profit signals that deserve your attention
ROAS only works when the conversion value is real
ROAS is simple math: revenue divided by spend. Google phrases the target version the same way: your target ROAS is the average conversion value you would like to get for each dollar you spend on ads. Google also warns that setting a target too high may limit the amount of traffic your ads may get.
That second sentence is where most accounts break.
The mechanism comes first. You feed the algorithm a value per conversion. It predicts value per auction and bids high when it smells money, low when it does not. If the value you feed it is inflated, duplicated, or disconnected from margin, the result looks efficient while the business loses.
I audited a Shopify brand reporting 420% ROAS that counted every initiated checkout as full revenue and ignored refunds. Cleaning the tracking cut reported ROAS to 260% overnight. Nothing changed except the truth.
ROAS only predicts profit when conversion value equals cash you keep. That means after returns, after cancellations, and weighted by margin.
Practical takeaway: fix value tracking before you raise or lower a ROAS target.
CPA only works when the acquisition can close
CPA has the same condition. Cost per acquisition matters only if the acquisition is qualified.
I used to tell clients a $42 CPA was good. I was wrong to say it without asking what $42 bought. For one home services account, $42 bought 214 form fills in a month and 19 booked jobs. The real cost per booked job was $472.
We changed the conversion action to booked calls only, added offline import for jobs that closed, and let Smart Bidding learn on that. Volume dropped by half. Profit doubled.
If you sell leads, replace raw CPA with:
- Cost per qualified lead
- Cost per booked job or qualified demo
- Cost per closed deal
Show all three beside spend.
Count what sales can close, not what marketing can collect. That is the core of the seven metrics that reveal true campaign profitability.
Incrementality answers the question Google cannot
The hardest question in Google Ads is also the most profitable one: did the ad create the sale, or did it take credit for a sale that was already happening?
Branded search is the usual suspect. I had a client showing a beautiful 9.2 ROAS on brand terms, and the agency before me reported it as their win. We ran a simple holdout: geo-paused brand for two weeks in one metro, kept it live in a matched metro, and watched total booked revenue.
The difference was 11%.
The campaign was not generating demand. It was taxing it at $3,800 a month in click costs for customers who typed the company name.
If you count every conversion Google reports as incremental, you will scale waste and call it scaling winners.
My replacement is boring and hard to game: blended revenue divided by total ad spend, tracked beside the platform number. In my sheets, I also track profit per click:
(Gross profit after refunds and cancels − ad spend) ÷ clicks
When that number rises, something real improved. When platform ROAS rises but profit per click falls, Google found cheaper clicks that are worth less.
This will not work for everyone. If you run 90% branded traffic with no tracking of your organic baseline, your first blended read will look ugly. Sit with that before spending more.
The full breakdown of these swaps lives in the diagnostic alternatives to each vanity metric.
Practical takeaway: judge scale by blended profit, not in-platform ROAS.
Build a dashboard you would defend to sales
My honest dashboard fits on one screen. It includes:
- Spend
- Qualified conversions
- Cost per qualified conversion
- Tracked profit after refunds and cancellations
- Blended profit per click
That is it.
No CTR column. No impression-share trophy. No clicks chart climbing into the corner like it deserves a bonus.
I check conversion tracking first, because if that is dirty, nothing downstream matters. Then I compare this week with the prior four-week average, not last week alone. Weekly noise will trick you into touching things that were working.
Say you spend $20k a month and booked jobs move from 42 to 51 at the same spend after you cut two broad ad groups. That is a decision. Clicks up 12% is not.
A useful dashboard makes weak performance harder to hide, including from yourself.
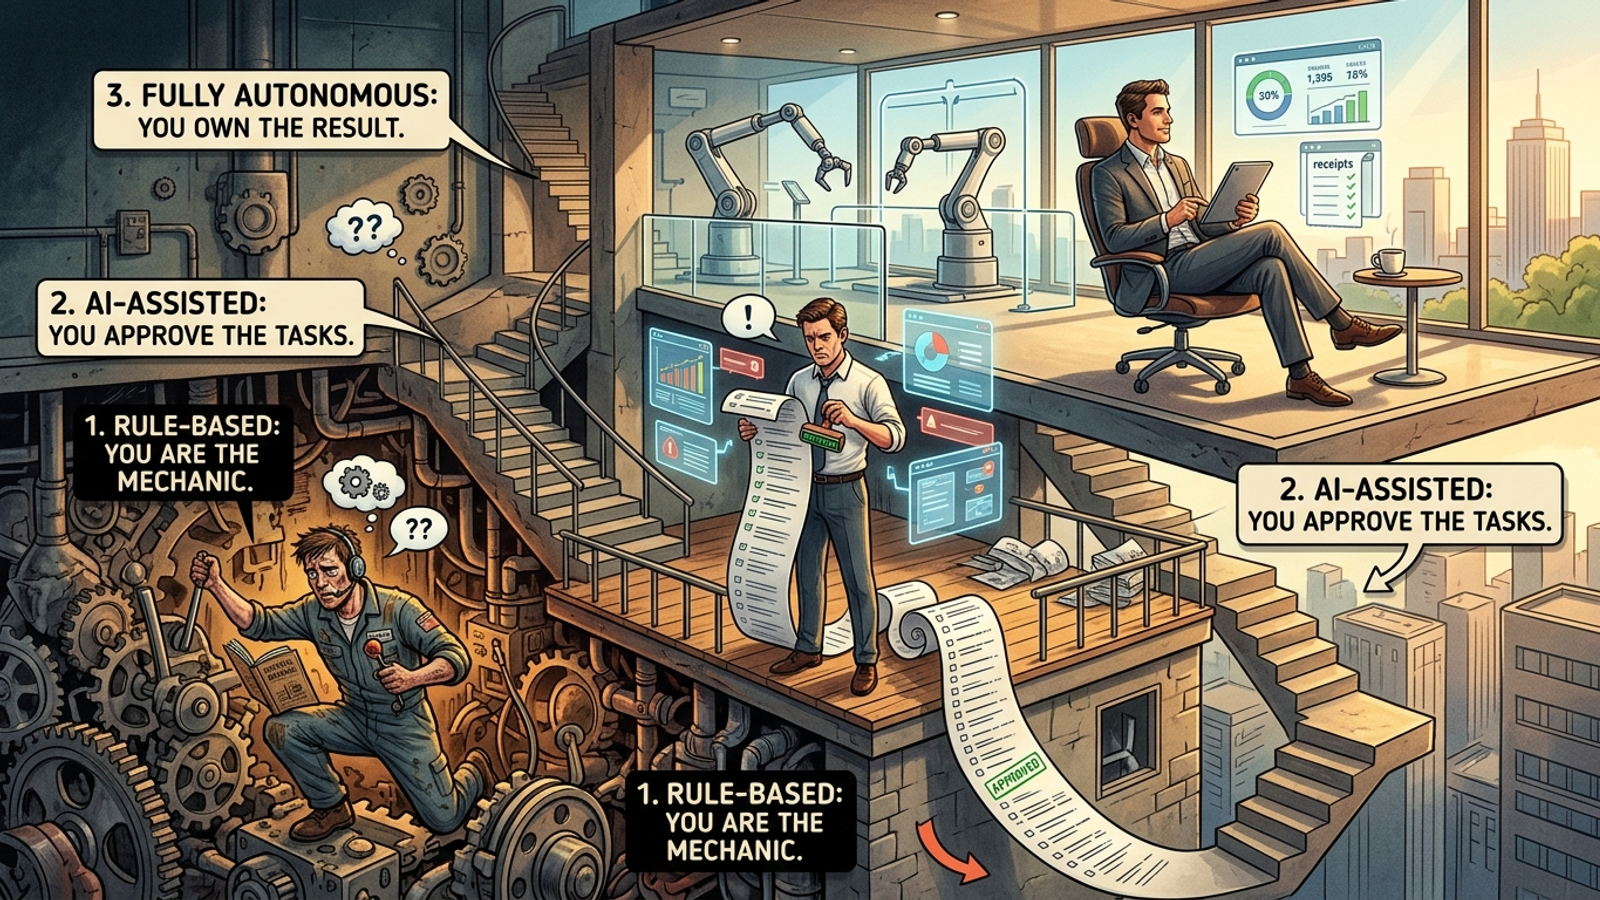
This is also where I stopped pretending that a human checking in once a day could keep up. Bids shift every auction. Search terms drift every hour. A person reviewing on Friday catches the waste on Friday, after it already spent Monday through Thursday.
I run my accounts inside groas now because the engine watches those profit signals continuously and moves budget within guardrails I set, then logs what it changed and why. I still own direction and limits. The machine owns the 2am bid change I used to miss.
Practical takeaway: build the report you would defend to sales, then give daily execution to something that never sleeps.
If you run that $20k account from the opening, pull the last 30 days and make the swap this week:
- Hide CTR, impression share, and raw clicks from the main report.
- Show cost per qualified conversion and profit per click beside spend.
- Compare each campaign against blended revenue and profit, not its own platform claims.
My bet is that one campaign you thought was winning drops to the bottom, and one boring exact-match campaign you ignored carries the business.
That is the account telling the truth for the first time.
I kept sending green reports for years because they made my job easier. They also made my clients poorer, which is why I stopped.
Judge every change by profit per click, and the vanity numbers lose their pull. When I need that judgment applied every hour instead of every Friday, I let groas do the bid and budget work inside my guardrails while I own the strategy. The dashboard stays honest because the execution finally has to be.