

 LinkedIn

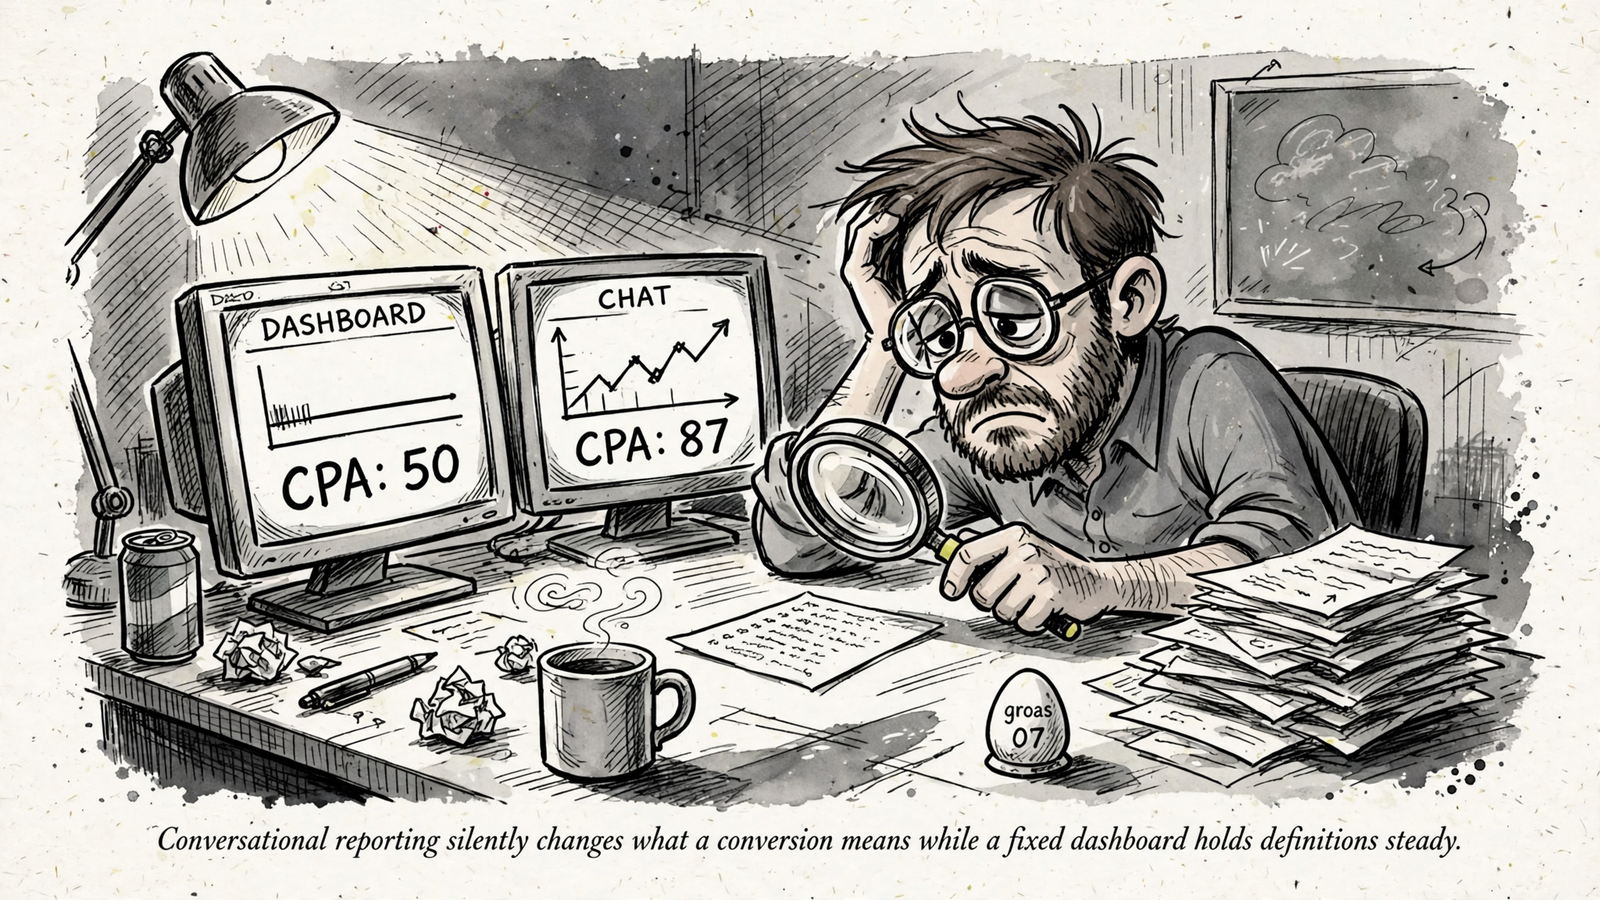
Replacing Looker Studio with Claude and groas is a regression if every conversation quietly changes what a conversion means. If you own spend across Google, Microsoft and Meta, that is the comparison I would make before deleting a single dashboard: which workflow keeps the metric contract intact?
Looker Studio gives you a stable reporting view. Claude with groas lets you question the underlying ad data and follow an investigation with an approved change. Those are different jobs. A smoother summary does not make them interchangeable.
My pick for the marketer who has to explain CPA on Monday and move budget on Tuesday is Claude with groas. But it has to earn that job by preserving the definitions, not by sounding confident. Keep one fixed reference until it does. A clean dashboard is not proof of clean numbers, either. Sometimes it just means the definitions stopped moving long enough to screenshot them.
Before the comparison: put the metric contract on one card
Before either tool gets a vote, write down what you are comparing. I call this the metric contract. It is not a reporting strategy deck. It is the short list of definitions nobody gets to change halfway through an answer:
- Account scope: which Google, Microsoft and Meta accounts count, and which test accounts and old pixels do not.
- Currency: the reporting currency used for spend and cost calculations.
- Time zone and date rule: where yesterday starts and ends, and which date basis the report uses.
- Attribution windows: the window used for each platform’s reported conversions.
- Conversion actions: the named actions that count toward the result.
- Outcome type: platform-attributed claims or deduplicated business outcomes from the CRM or store.
Skip this and you will argue about dashboards when you should be arguing about denominators.
Google reporting 190 leads, Meta reporting 195 and a CRM showing 290 jobs does not give you a tidy addition problem. It gives you a reconciliation problem. A blended total can hide double-claims and view-through counts. Neither interface fixes that by making the total easier to read.
Lock the meaning before comparing the answers. Otherwise, the tool with the prettiest output wins an argument nobody actually settled.
1. Repeatability: Looker Studio keeps the question still
Looker Studio wins the first axis because a recurring report preserves the view: the selected accounts, charts, filters and calculations. That stability matters when the same people need to read the same report every Monday.
It does not freeze reality. Historical numbers can change, and a fixed chart can repeat the same mismatch every week. The useful promise is narrower: you do not have to restate the entire question every time you open the page.
Claude needs that question made explicit. Ask for “last week’s CPA” in a fresh conversation and you leave room for a new date range, a different conversion action or a platform default you did not intend. The arithmetic can be immaculate while the comparison drifts.
My starting prompt would be:
Compare Google, Microsoft and Meta under the reporting contract below. Return incompatible metrics separately. State missing data. Show source accounts, retrieval time, formulas and conversion-action scope. Make no changes.
Then paste the contract. Do not assume the previous conversation carries the specification into the next one.
There is also a structural limit worth knowing about in Looker Studio: each blend supports up to five data sources and belongs to one report. Google plus Microsoft plus Meta plus GA4 plus CRM plus store therefore needs more work than one straightforward blend. That work belongs in the reporting setup, not in a footnote discovered after someone forwards the total.
Looker Studio wins repeatability; Claude has to demonstrate it. Ask the same locked question, inspect the definitions, and explain discrepancies before replacing the recurring view.
2. Inspection: show the denominator, not just the CPA
Looker Studio also wins inspection of a standing report. You can open the data source, inspect the formula and check the blend behind the chart. That does not guarantee the setup is right. It gives you a fixed setup to examine.
Claude with groas works from the underlying ad accounts rather than treating your dashboard as the specification. That is useful for investigation, but it means the answer must carry its own working: accounts, dates, conversion actions and formulas.
If Claude cannot show the denominator, I do not accept the ratio. I apply the same rule to a dashboard whose calculated field nobody wants to open.
Three disputes account for much of the trouble.
Divide totals by totals
Total spend divided by total conversions is not the average of campaign CPAs. Averaging the ratios gives a small campaign the same weight as a large one.
Take a £20 CPA on 10 conversions and a £60 CPA on 200 conversions:
- The average of the two CPAs is £40.
- Total spend is £200 plus £12,000: £12,200.
- Combined CPA is £12,200 divided by 210 conversions: about £58.
Same inputs, different question. One asks what you paid per result. The other asks for the average of two ratios. Only one belongs in the blended CPA box.
Require the formula, not just a number with two decimal places. Precision is cheap when the denominator is wrong.
Match windows, not just date labels
“Last week” does not settle attribution. Attribution windows differ across platforms and can be set at different levels. Matching the date labels does not make those conversion counts equivalent.
Time zones create another mismatch. A report using one time zone and an account using another can place activity on different dates. Connector freshness adds a separate question: when was each source last updated? A dashboard loaded at 9am is not necessarily a report of everything that happened by 9am.
I would check three things before debating a gap:
- Did both answers use the same date boundaries and time zone?
- Did they use the agreed attribution windows and conversion actions?
- Were the sources retrieved at comparable times?
Do not ask a polished summary to conceal those differences. Put them beside the numbers.

Separate platform claims from customers
Summed platform conversions are claims, not necessarily unique customers. One purchase touched by several channels can appear in more than one platform’s reporting.
That is why deduplication assigns each conversion once. Your contract needs two distinct lines:
- Platform-attributed conversions for diagnosing what each channel reports.
- Deduplicated business outcomes from the CRM or store for judging the business result and informing budget decisions.
Do not discard platform reporting. Do not promote its sum into a customer count, either. A dashboard and a chat answer can make the same mistake; chat just explains it more pleasantly.
My inspection rule is simple: never let either tool add Google, Meta and Microsoft conversions into one total without labeling what that total means. If it is claims, call it claims.
3. Investigation: Claude with groas earns the work beyond the chart
Once the definitions are locked, Claude with groas becomes the stronger option for investigation. It can query the connected ad accounts, examine a spike and explain what it finds in plain English. The fixed report remains the reference; the conversation follows the next question.
That distinction matters. A recurring dashboard answers the question you designed it to answer. When the number looks wrong, the work often moves elsewhere: an export, a pivot, another platform tab. With Claude and groas, the follow-up can stay in the conversation.
But the first follow-up should not be “what budget should I move?” It should be “why does this differ?”
I would use this sequence:
- Ask for the same locked week shown in the fixed report.
- Require accounts, retrieval time, formulas and conversion-action scope.
- List incompatible or missing data separately.
- Explain the discrepancy before interpreting performance.
A different answer is not automatically a better answer because it arrived in a sentence instead of a chart. It may reflect fresher data. It may reflect a different window. It may be answering a question you did not mean to ask.
Claude with groas wins investigation, not permission to rewrite the recurring report. Keep the reference still while the conversation does the detective work beside it.
4. Execution: groas connects the explanation to an approved change
This is where the comparison stops being a contest between reporting interfaces. Looker Studio shows the account. Claude with groas can help you work on it.
I would still separate diagnosis from execution. First, ask for the numbers under the contract and a list of incompatibilities. No recommendations yet. Then ask for a proposed budget shift, with the expected CPA math shown, as a preview rather than an edit.
That separation makes it harder for a plausible explanation to slide straight into an account change. It also gives you something concrete to approve or reject.
With groas connected to Claude, approved changes can be made across Google, Microsoft and Meta. Every change is logged with its reason and can be undone in one step. That is the practical advantage over finding the issue in a report and then doing the clicking yourself.
The log has a limit, though: it proves what changed and records why. It does not prove that the attribution behind the decision was correct. An impeccably documented budget move can still rest on a bad conversion total.
Use the log for accountability and the contract for meaning. Claude with groas wins execution because the investigation can lead to an approved, recorded action. The denominator still has to survive the trip.

The head-to-head in one table
The split is clear: Looker Studio holds the recurring question steady; Claude with groas takes the investigation through to action.
| Decision axis | Looker Studio | Claude with groas | Winner |
|---|---|---|---|
| Repeatability | Preserves the report’s configured scope, filters and calculations | Needs the explicit contract carried into each reporting request | Looker Studio |
| Inspection | Standing sources, formulas and blends can be inspected | Must show accounts, retrieval time, formulas and conversion actions with the answer | Looker Studio |
| Investigation | Follow-up analysis can mean leaving the report for exports and pivots | Queries connected ad accounts and explains findings conversationally | Claude with groas |
| Execution | You take the finding elsewhere to make the change | Approved changes are logged with their reasons and can be undone | Claude with groas |
The tie on axes does not make this a draw. The winner follows the job. If you own performance, the ability to investigate and act matters more than preserving every recurring chart. If you publish a fixed report for other people, repeatability is the job.
Verdict: pick Claude with groas, keep one fixed reference
For the marketer responsible for Google, Microsoft and Meta spend, I pick Claude with groas. The goal is not to produce a better Monday report and leave the account untouched until next Monday. It is to understand what happened and make the next decision without rebuilding the analysis somewhere else.
That is the useful version of replacing recurring reports with questions to an AI connected through groas: keep one locked reference page, then move investigation and approved changes into the conversation. Fewer reporting tabs. More work done from the answer.
Pick Looker Studio instead if your primary job is publishing the same defined number to people who will not join the investigation: finance, a client, a founder who forwards screenshots. Give them one page with the contract printed on it. They should not need access to your chat history to understand the total.
The distinction is the same one behind the chat-versus-Looker-Studio verdict for SEO dashboards: conversation suits the person doing the work; a fixed view suits the person who needs to inspect a recurring definition.
For a $20k-a-month mix across the three platforms, here is the workflow I would use:
- Keep one Looker Studio page, with the contract in a text box above the charts.
- Every Monday, ask Claude for the same locked week under that contract.
- Require sources, retrieval time and formulas with the answer.
- If the numbers differ by more than a few percent, log the gap. Check windows, time zones and conversion-action scope before discussing performance.
- Reconcile the gap before using the conversational answer to justify a budget change.
The fixed page is a reference, not holy scripture. If it is wrong, fix it. But do not average two conflicting answers and call that reconciliation.
So delete the other twelve tabs if they no longer earn their keep. Pick Claude with groas if you own the outcome and want fewer reports between a question and an approved fix. Pick Looker Studio if publishing a stable, inspectable number is the deliverable. Do not retire the fixed view because chat sounds confident. Retire it only when the recurring questions preserve the contract.
My reporting contract fits on an index card: accounts in, accounts out, currency, time zone, date rule, window per platform, named conversion actions. One final line says the blended total means claims unless the CRM says otherwise. Tape that to the dashboard and paste it into Claude. The tool that honors the card gets the work.


